How To Interpret Get Started
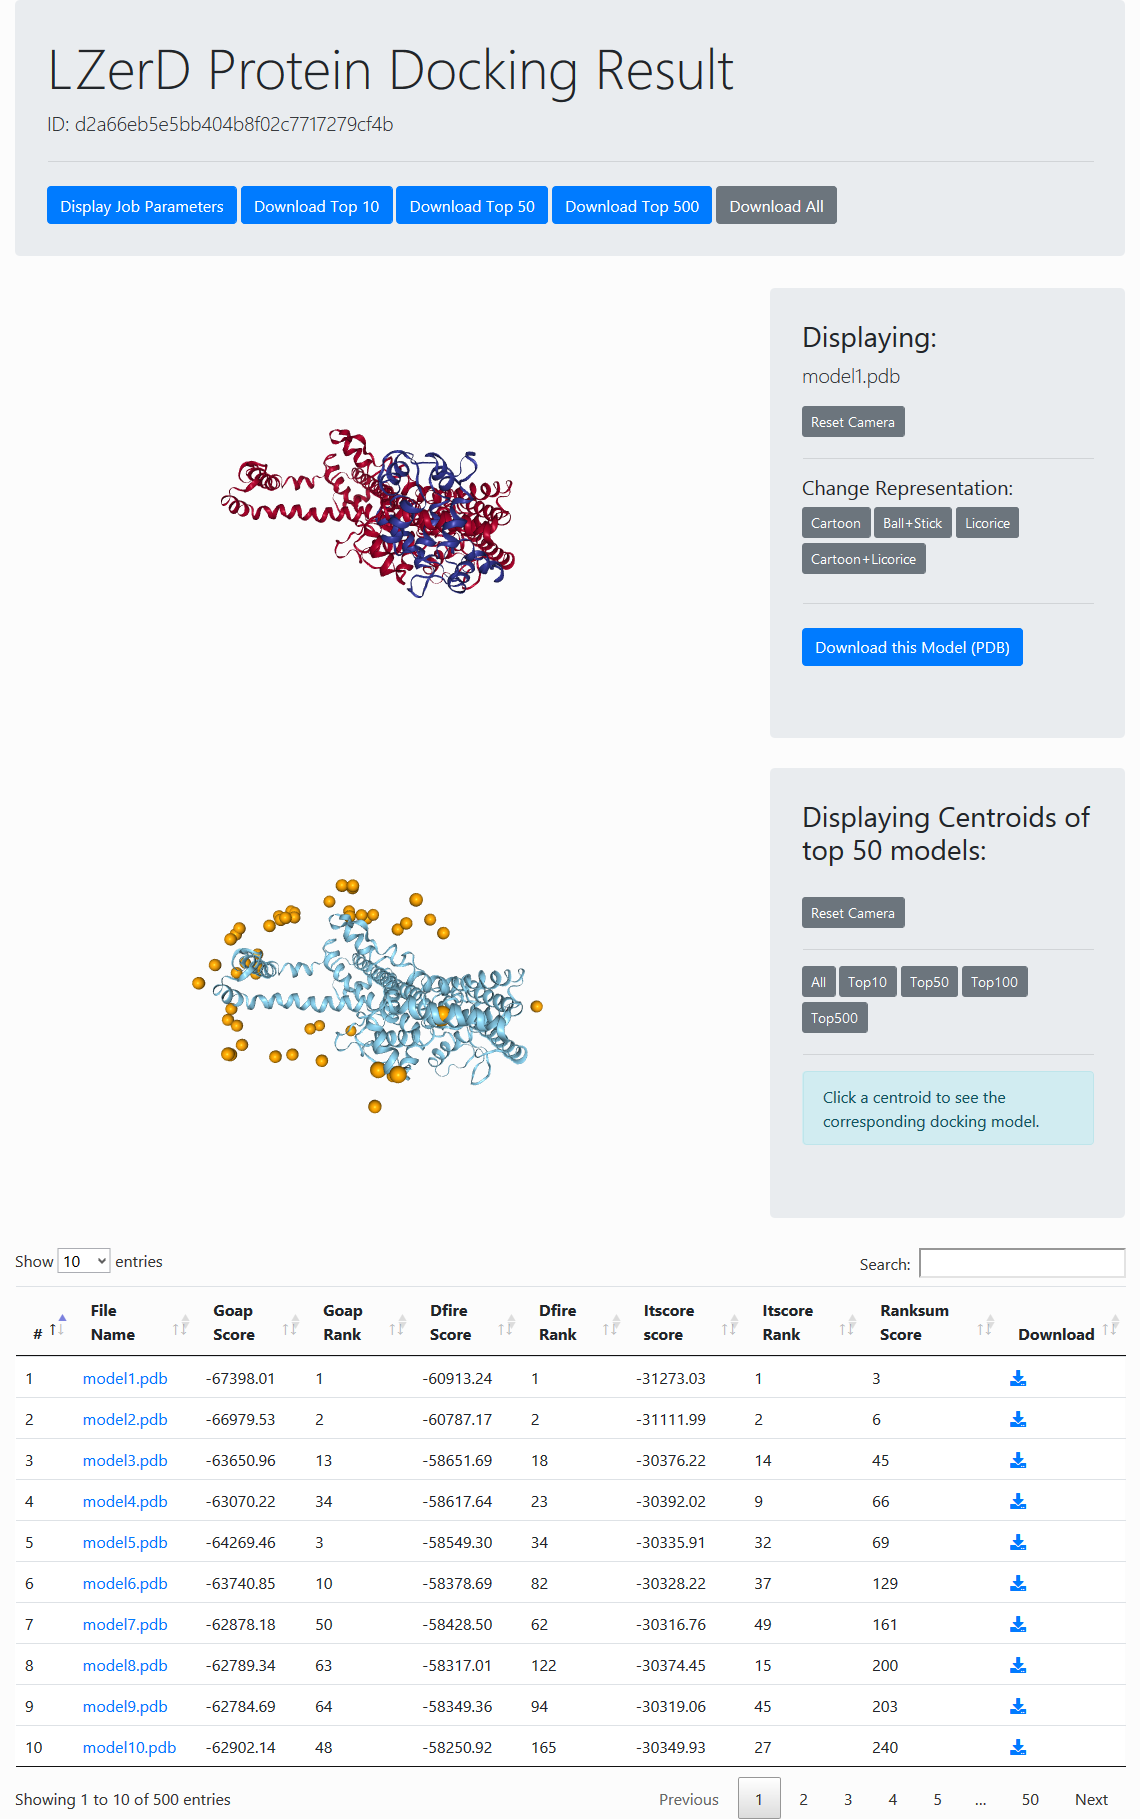
The models output by the LZerD webserver have already been clustered and re-ranked according to our ranksum score. You can select individual models to view or download them, or you can click the link to download all models. The total number of models is usually several thousand, but may be up to 50,000. The results page also includes a summary view showing the distribution of ligand binding poses on the receptor. The receptor is shown in a cartoon representation, while the ligand centroids are shown as spheres.
Result Overview
The result overview page (see the figure to the right) contains general information about the docking results. At the top of the page are buttons for variously viewing the parameters and inputs used for the job and for downloading the top 10, 50, or 500 models.
Below the header is an interactive panel for viewing the docking models. You can manipulate the view by dragging to rotate or scrolling to zoom. In the centroid view, each centroid represents a docked ligand position. You can click any centroid within the top 500 to see the full-atom representation of that model. In the panel to the right of the centroid view, you can choose how many centroids to display. In the individual model view, various representations can be selected in the panel on the right.
Models are evaluated by four scores, GOAP, DFIRE, ITScore, and Ranksum. You can rerank the models by a score in the table by clicking the arrow at the top row. GOAP, DFIRE, ITScore, are statistical potentials developed by the Skolnick lab, the Yaoqi Zhou lab, and the Xiaoqin Zou lab, respectively. Ranksum is primarily used for ranking the models, which is computed as the sum of the ranks from the three scores (thus the smaller, the better). Ranksum is the recommended score to use for selecting models when you interpret the results. You can read about the constituent scoring functions in their papers, which are linked to from References.
In cases where any input models use overlapping chain identifiers, the chains in the output models will be automatically renamed and a message will be displayed. For example, the below message would indicate that chain A in the ligand subunit was renamed to chain B in the output models. This takes place only after the docking has been performed, and does not affect the way chains should be specified in constraints. Constraints are always applied using the original chain naming from the submitted PDB files.
Input structure #2: renamed 1 chain(s)
    old chain A -> new chain B
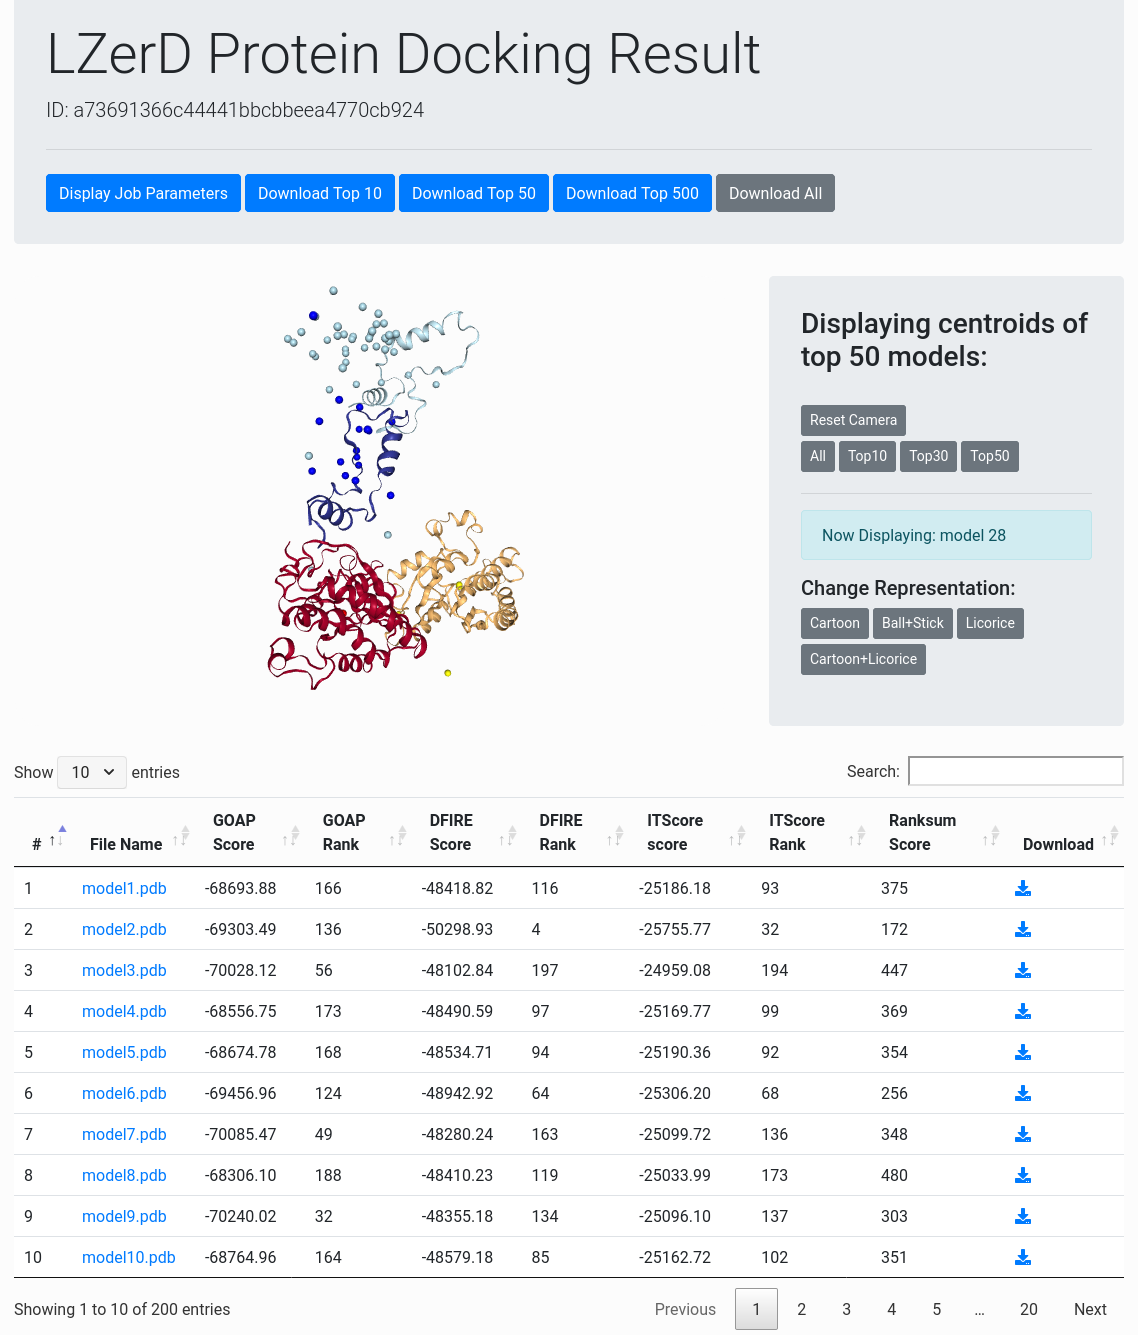
The models output by the Multi-LZerD webserver have already been clustered and re-ranked according to our ranksum score. You can select individual models to view or download them, or you can click the link to download all models. The total number of models is at most the population size selected during job submission. The results page also includes a summary view showing the distribution of the centroids of docked subunits relative to the first input structure. The first input is shown in a cartoon representation, centroids of the other inputs are shown as spheres.
Result Overview
The result overview page (see the figure to the right) contains general information about the docking results. At the top of the page are buttons for variously viewing the parameters and inputs used for the job and for downloading the top 10, 30, 50, or all models.
Below the header is an interactive panel for viewing the docking models. You can manipulate the view by dragging to rotate or scrolling to zoom. In the centroid view, each centroid represents a docked ligand position. You can click any centroid to see the full-atom representation of that model. In the panel to the right of the centroid view, you can choose how many centroids to display. In the individual model view, various representations can be selected in the panel on the right.
Models are evaluated by four scores, GOAP, DFIRE, ITScore, and Ranksum. You can rerank the models by a score in the table by clicking the arrow at the top row. GOAP, DFIRE, ITScore, are statistical potentials developed by the Skolnick lab, the Yaoqi Zhou lab, and the Xiaoqin Zou lab, respectively. Ranksum is primarily used for ranking the models, which is computed as the sum of the ranks from the three scores (thus the smaller, the better). Ranksum is the recommended score to use for selecting models when you interpret the results. You can read about the constituent scoring functions in their papers, which are linked to from References.
Unlike LZerD, Multi-LZerD is a stochastic algorithm which uses randomized search to avoid the computational cost of an exhaustive search. Therefore, Multi-LZerD may yield different output structures each time it is run.
In cases where any input models use overlapping chain identifiers, the chains in the output models will be automatically renamed and a message will be displayed. For example, the below message would indicate that chain A in subunit #2 was renamed to chain B in the output models. This takes place only after the docking has been performed, and does not affect the way chains should be specified in constraints. Constraints are always applied using the original chain naming from the submitted PDB files.
Input structure #2: renamed 1 chain(s)
    old chain A -> new chain B
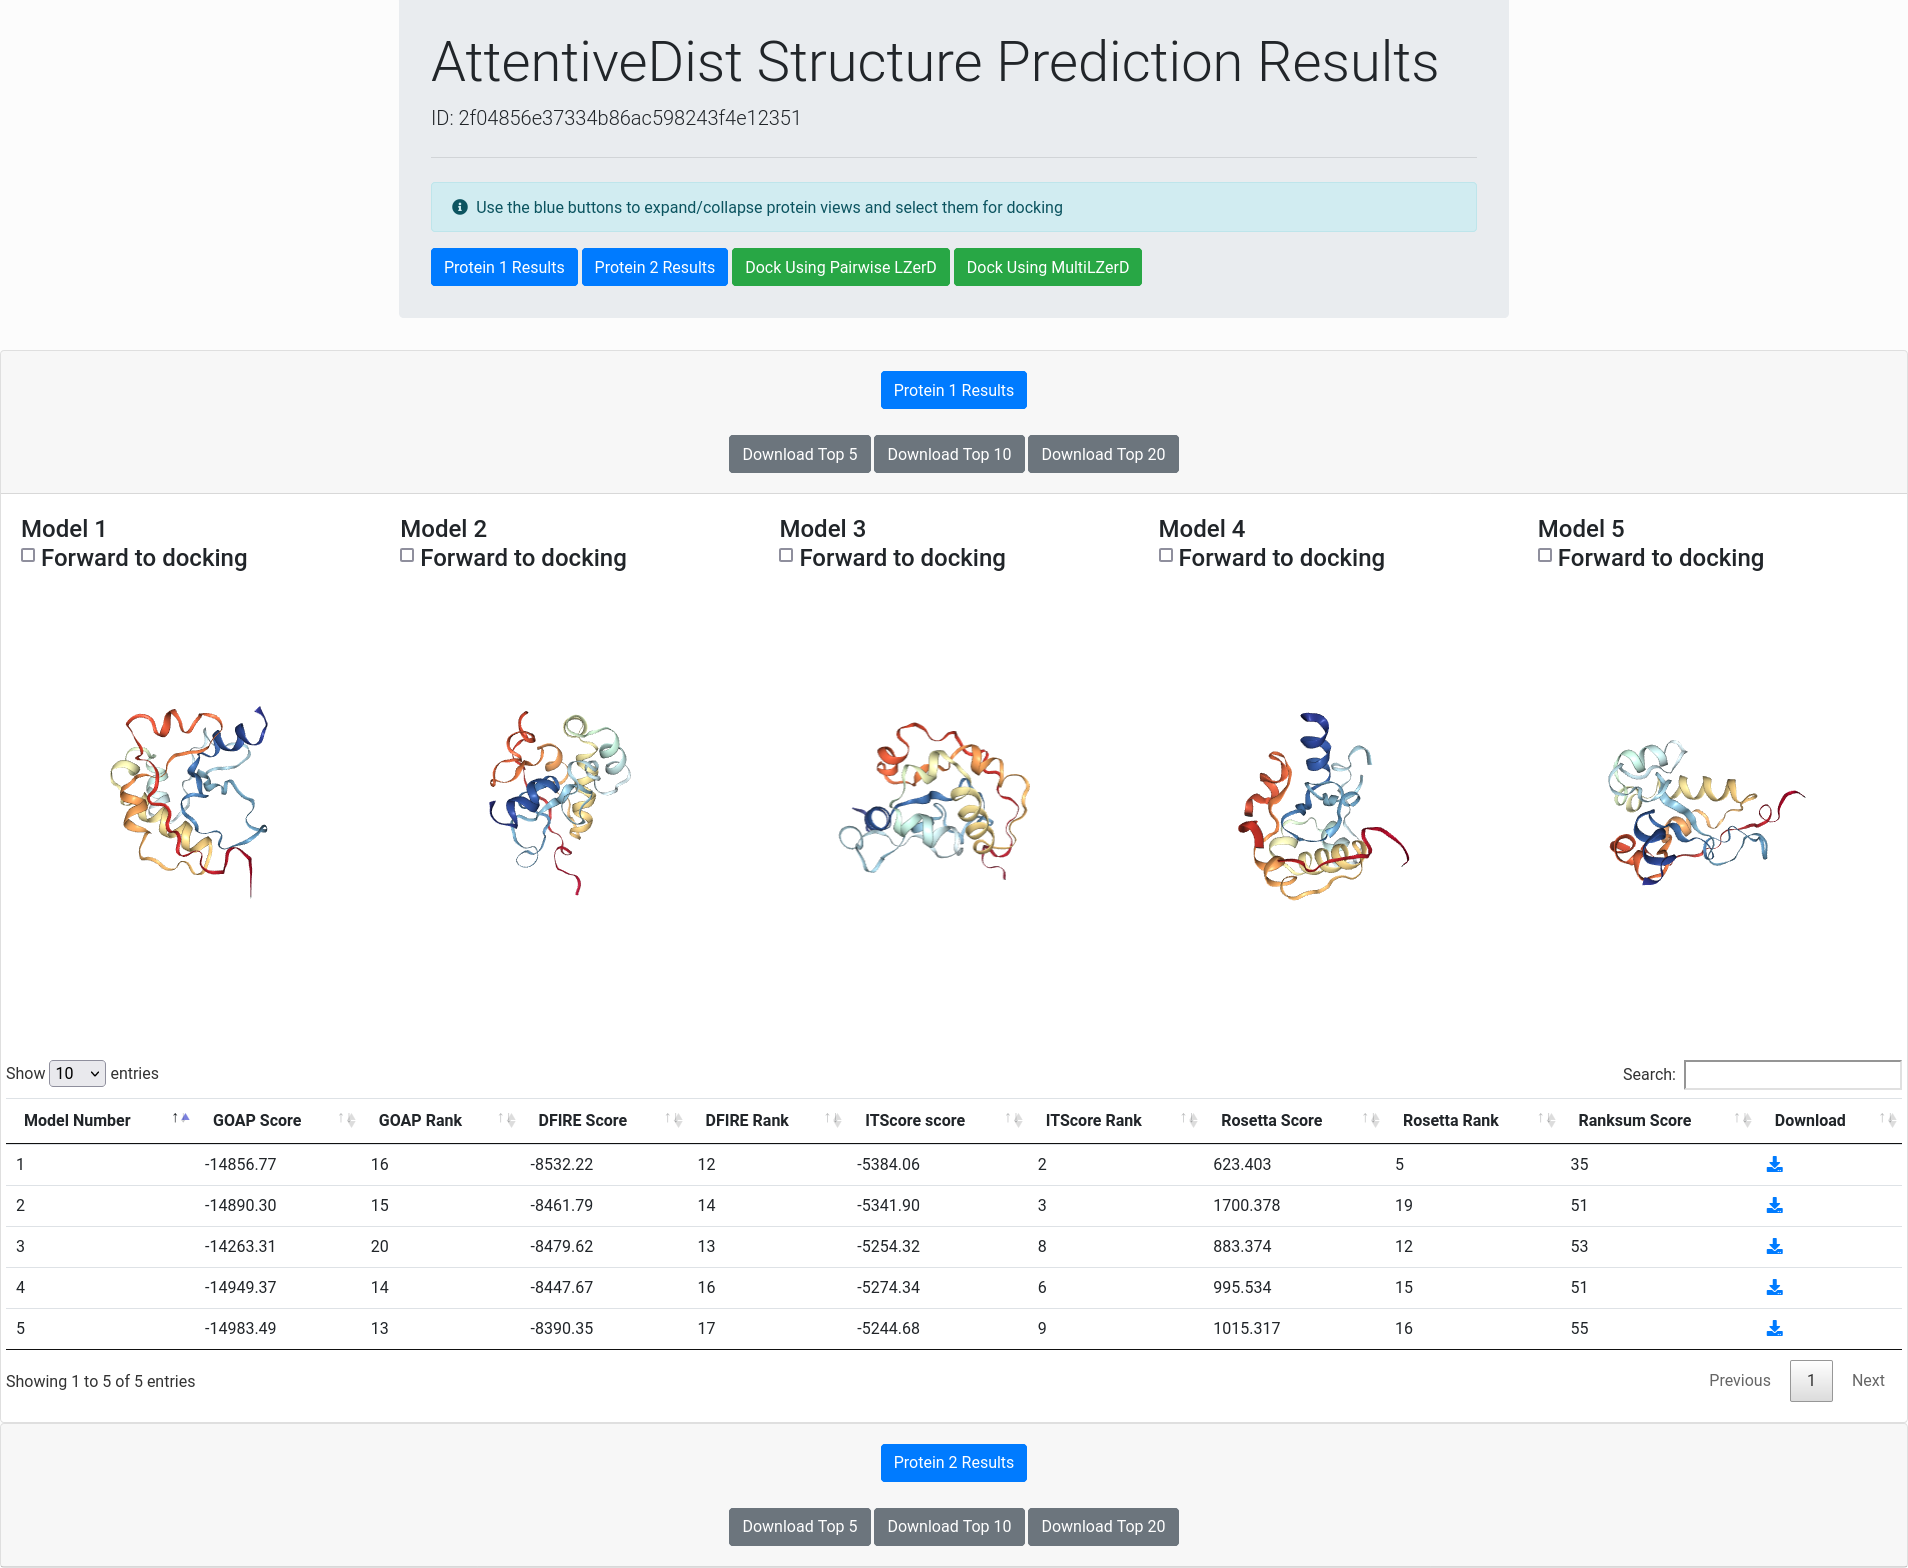
The single-chain models output by AttentiveDist have already been ranked according to our ranksum score. You can select individual models for download, and can also click the links to download models in bulk. The total number of models is at most 20.
Result Overview
The result overview page contains general information about the single-chain structure prediction results. At the top of the page are buttons for switching between different subunits and for forwarding models to LZerD or Multi-LZerD.
Below the header are interactive panels for each subunit for viewing their predicted structures. The blue buttons on each panel will expand the view for the corresponding subunit, just like the blue buttons in the header. Due to limits imposed by current web browsers, only one subunit's panel will be expanded at any given time. You can manipulate the views by dragging to rotate or scrolling to zoom. To select a model for forwarding to LZerD or Multi-LZerD, simply check the corresponding checkbox above the 3D view of the model. Once models have been selected for one or more subunits, simply click either the "Dock Using Pairwise LZerD" (2 subunits) or the "Dock Using Multi-LZerD" (3 or more subunits) green button as found above, and the models will be uploaded into a fresh LZerD or Multi-LZerD docking submission page.
Models are evaluated by five scores, GOAP, DFIRE, ITScore, Rosetta, and Ranksum. You can rerank the models by a score in the table by clicking the arrow at the top row. GOAP, DFIRE, ITScore, are statistical potentials developed by the Skolnick lab, the Yaoqi Zhou lab, and the Xiaoqin Zou lab, respectively, while Rosetta has been primarily developed by the Baker lab. Ranksum is primarily used for ranking the models, which is computed as the sum of the ranks from the four scores (thus the smaller, the better). Ranksum is the recommended score to use for selecting models when you interpret the results. You can read about the constituent scoring functions in their papers, which are linked to from References.